 KnowForge
Grafana
 qianmoQ· 更新于 2026-09-24· 阅读 5 分钟· 0 次阅读
Once Prometheus is up and running, Grana can be configured to monitor and visualize Ozone metrics.
Add Prometheus as a data source
In the Grafana web UI, go to Add Data Sources and then select Prometheus.
Enter the Prometheus hostname/port in the HTTP. For example, http://localhost:9094 (verify the port used by looking at Prometheus command line flags -web.listen-address. The port can also be found from Prometheus web UI → Status → Command-Line Flags.)
Choose Prometheus type: Prometheus
Choose Prometheus version: 2.37.x
Finish the setup by clicking on Save and Test.
Import a Grafana dashboard for Ozone
Apache Ozone comes with a default Grafana dashboard. Follow the instructions below to import it:
Download dashboard JSON:
wget https://raw.githubusercontent.com/apache/ozone/master/hadoop-ozone/dist/src/main/compose/common/grafana/dashboards/Ozone%20-%20Overall%20Metrics.jsonOpen Grafana portal and click on Dashboards on the left and select Import.
Click at Upload JSON file and select the file Ozone - Overall Metrics.json that was just downloaded.
The dashboard is now imported.
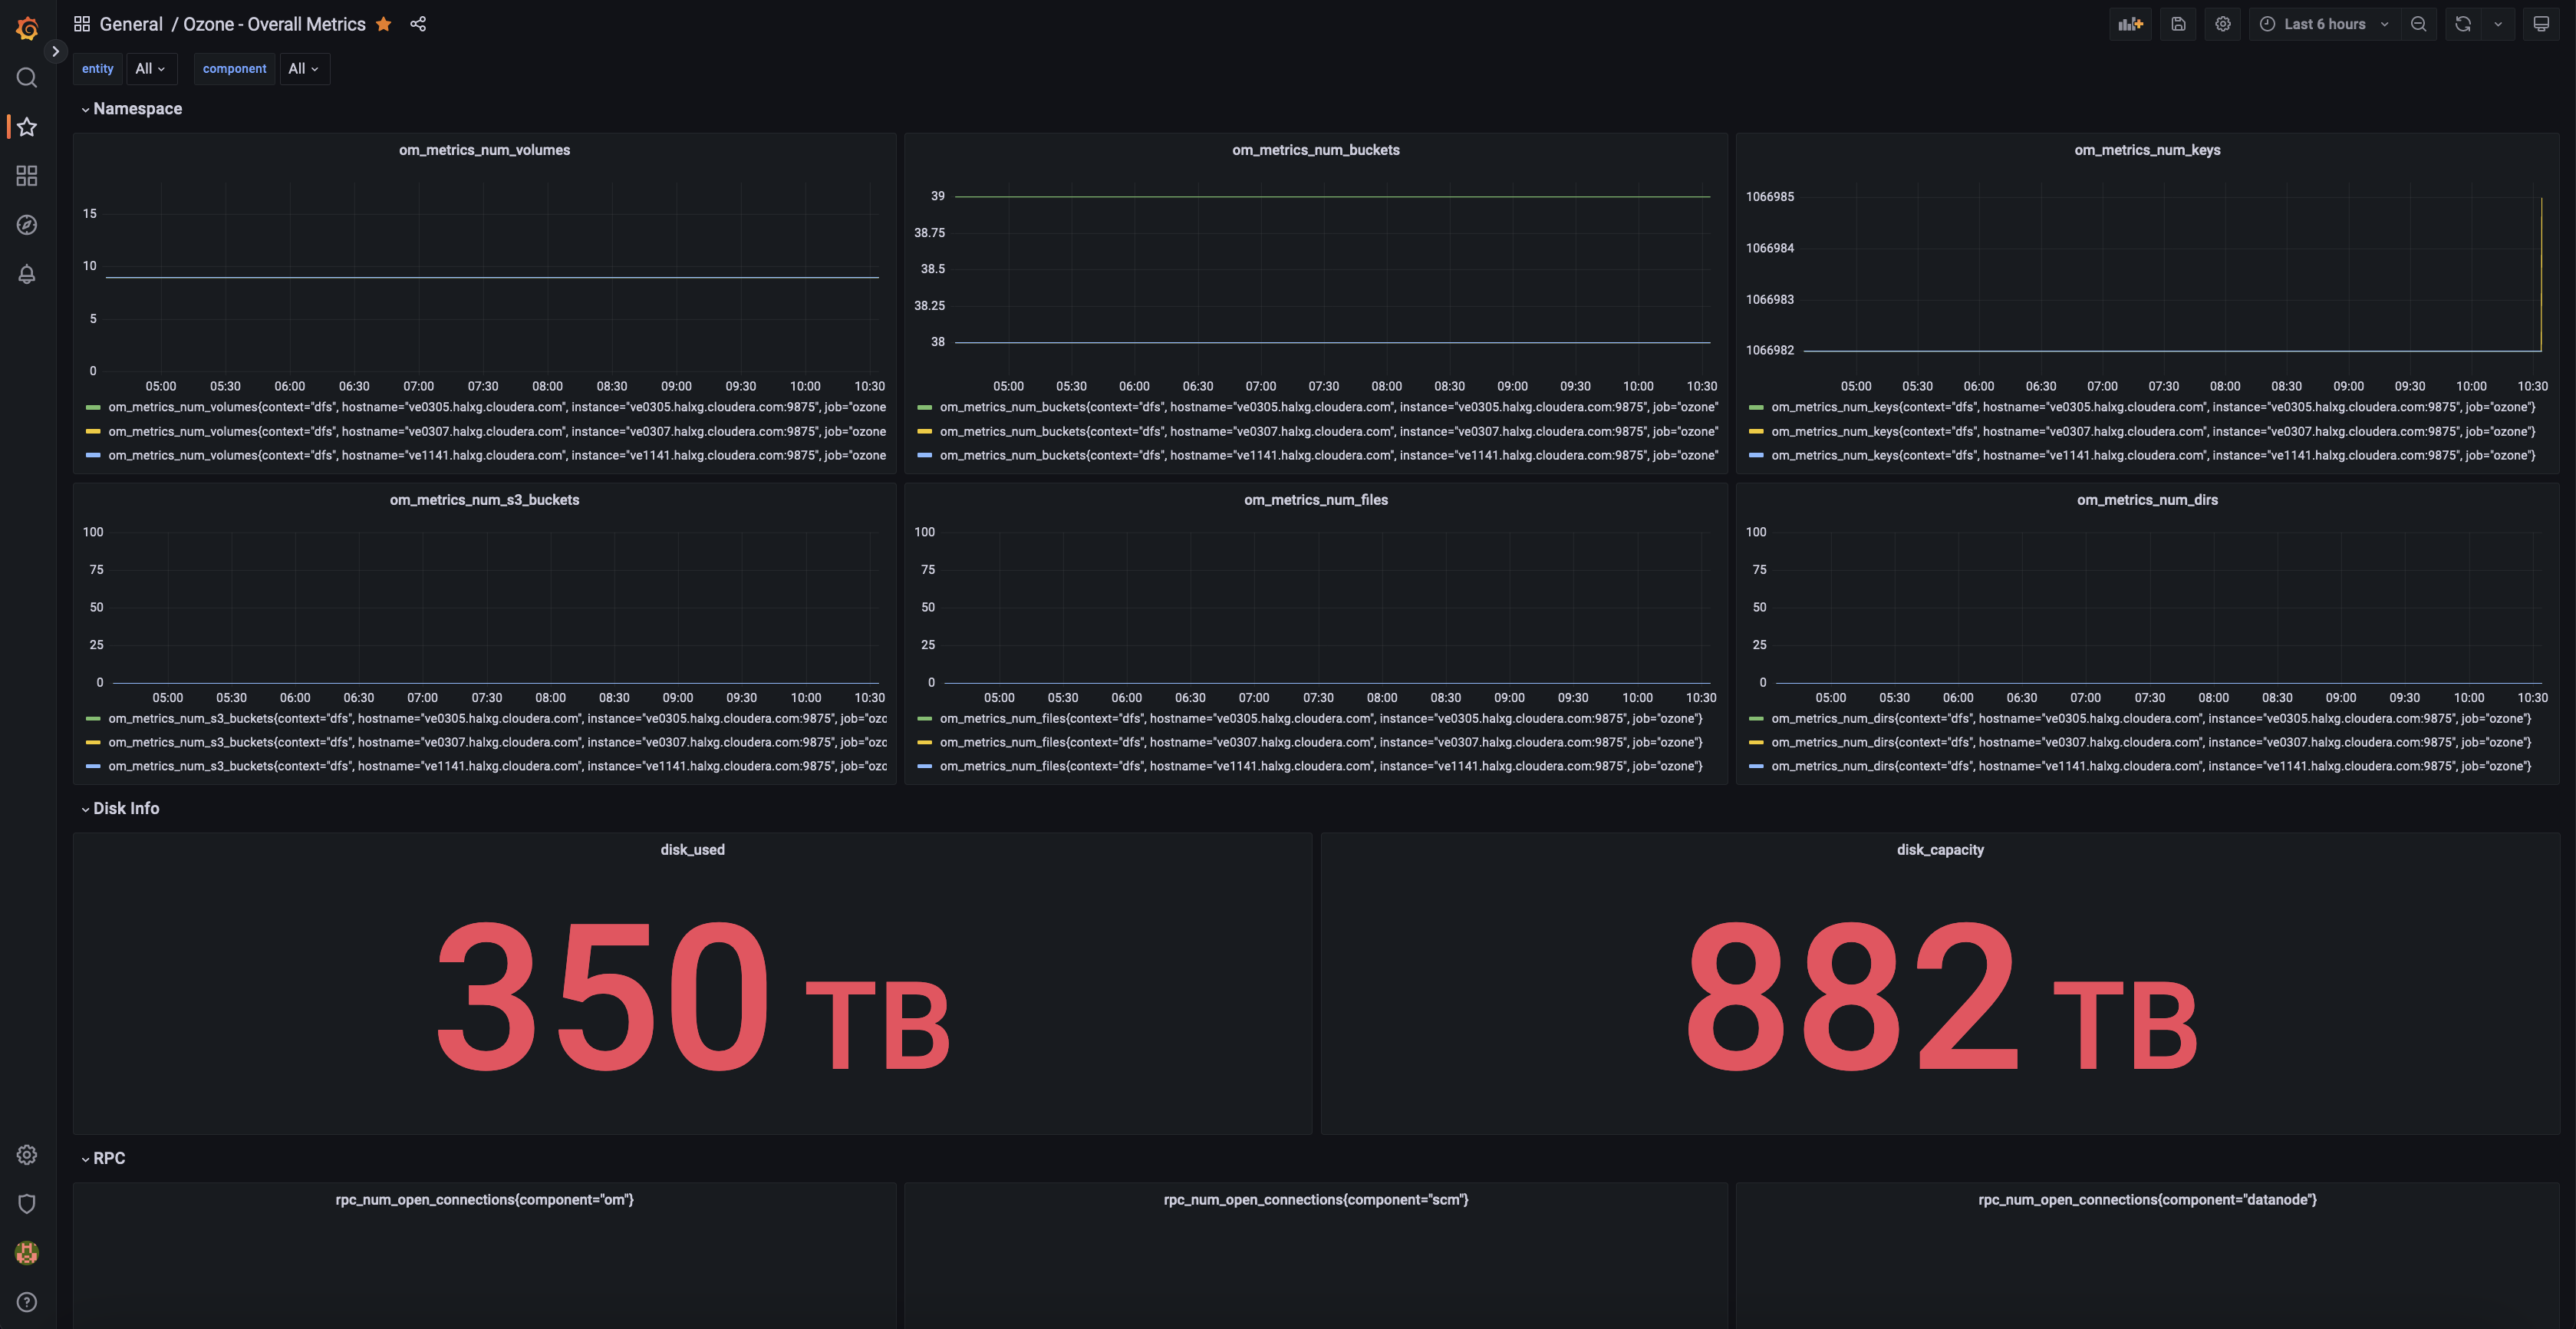
Repeat the same for Object Metrics dashboard and RPC Metrics dashboard.
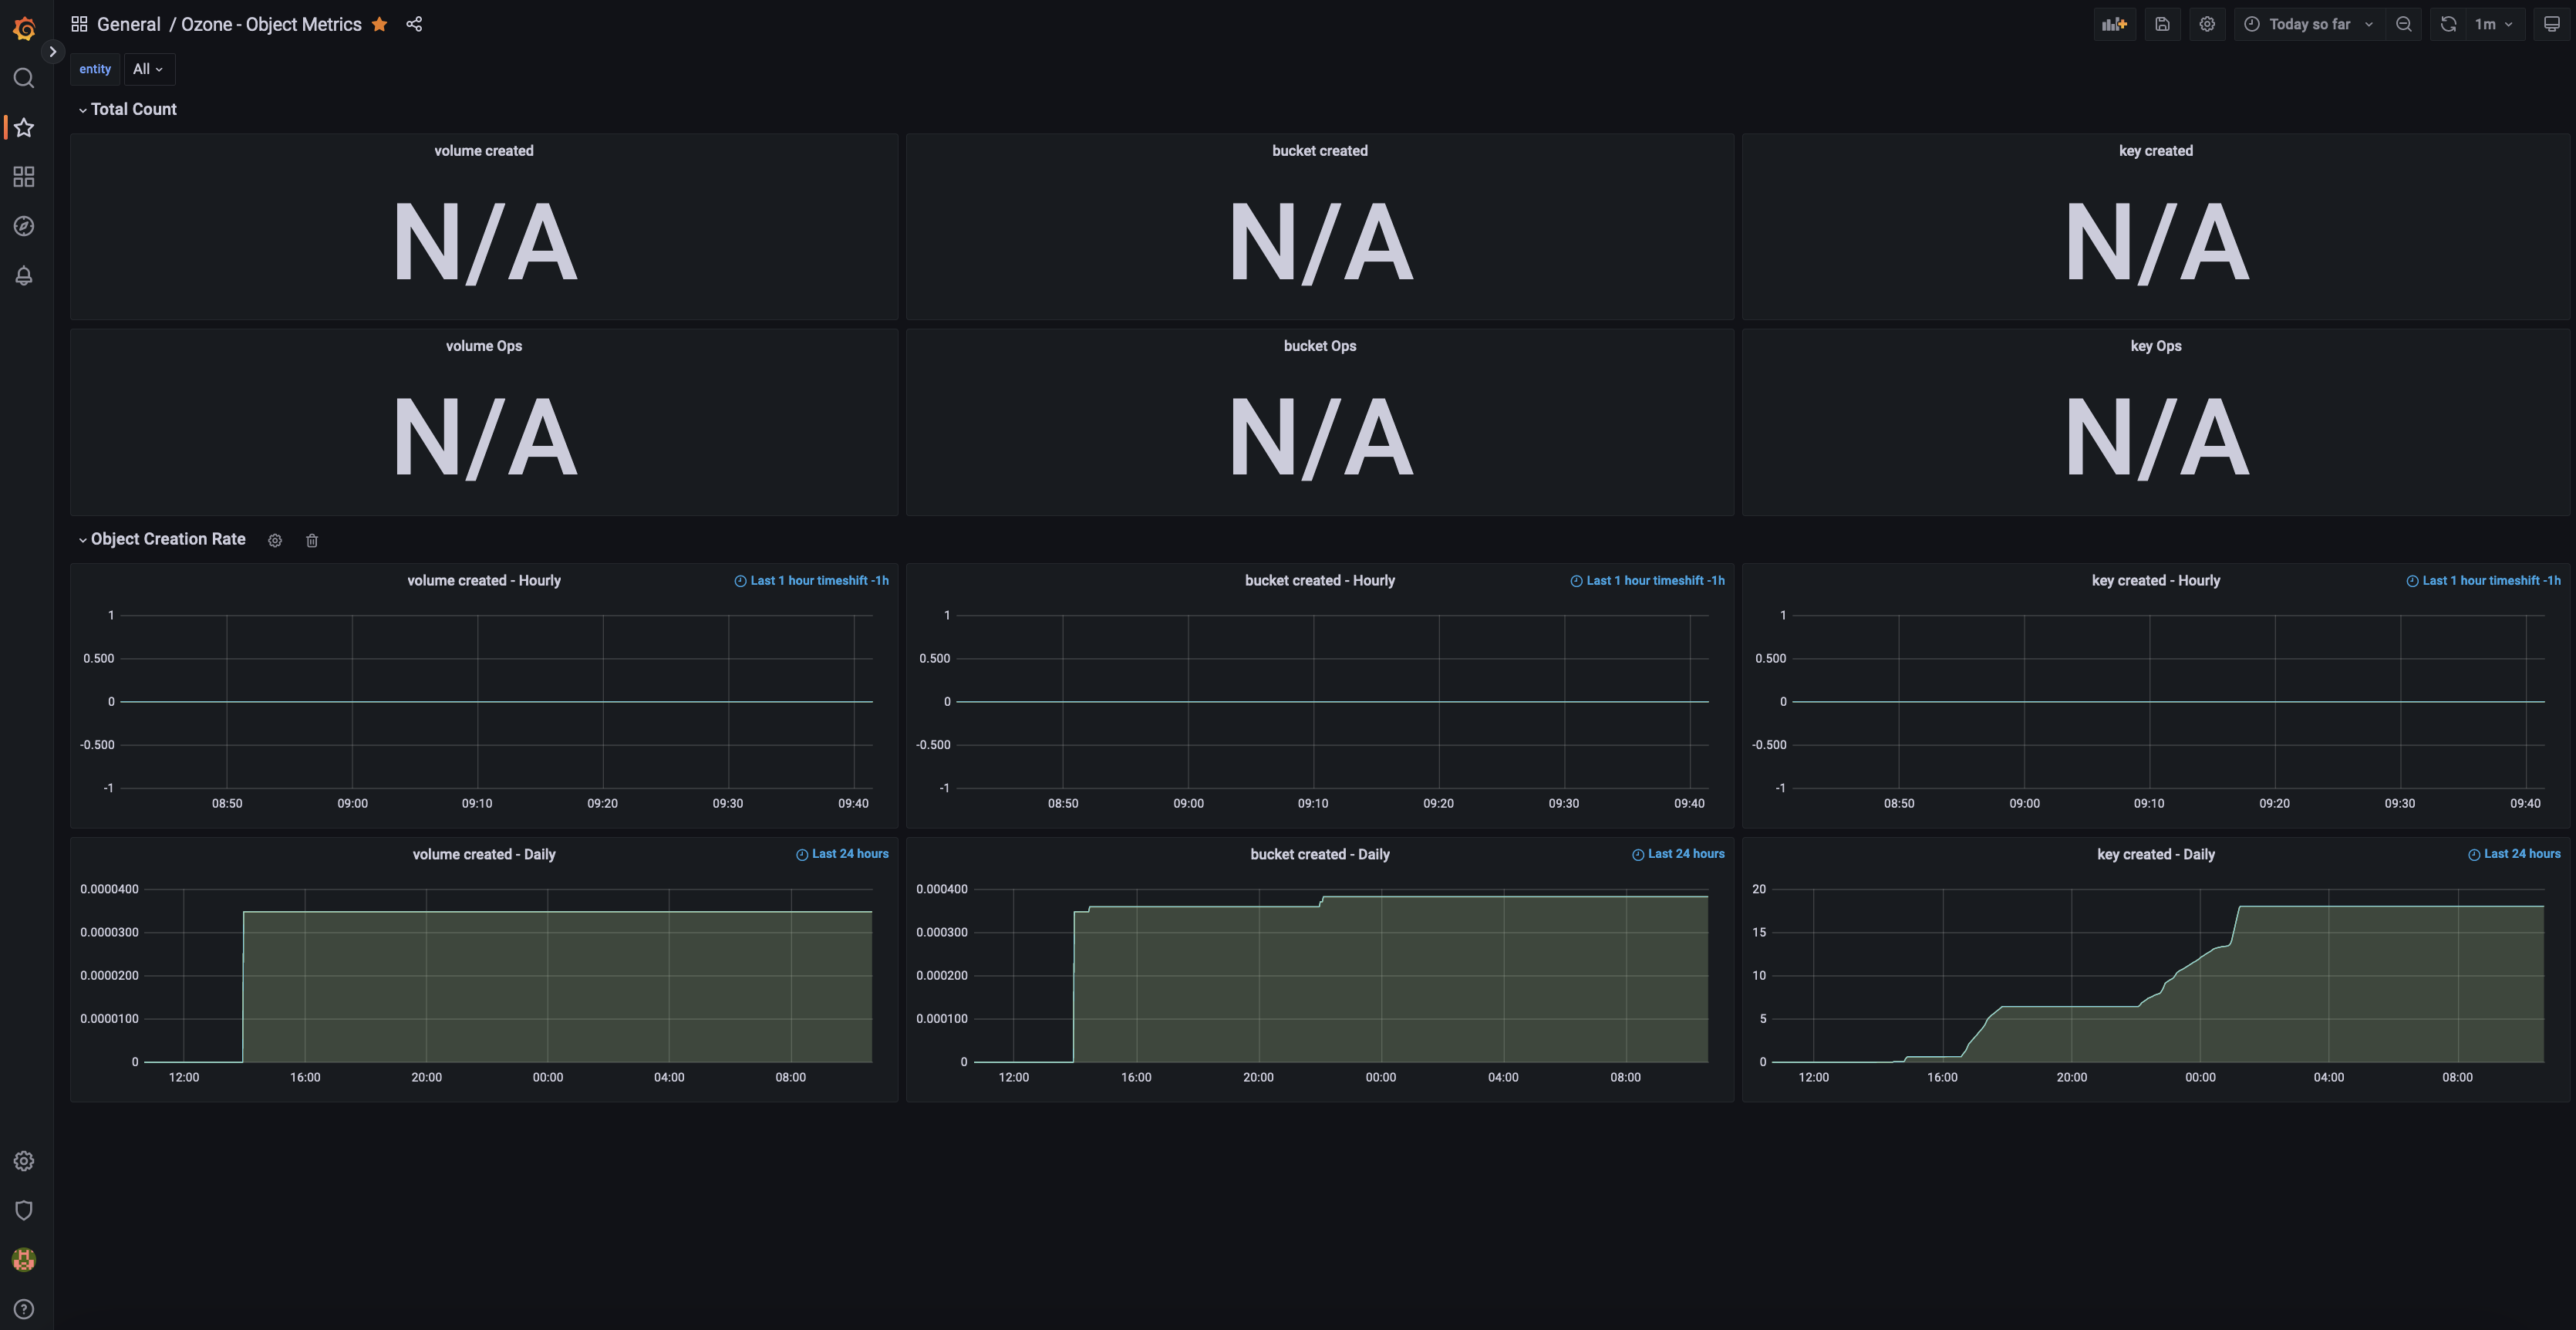
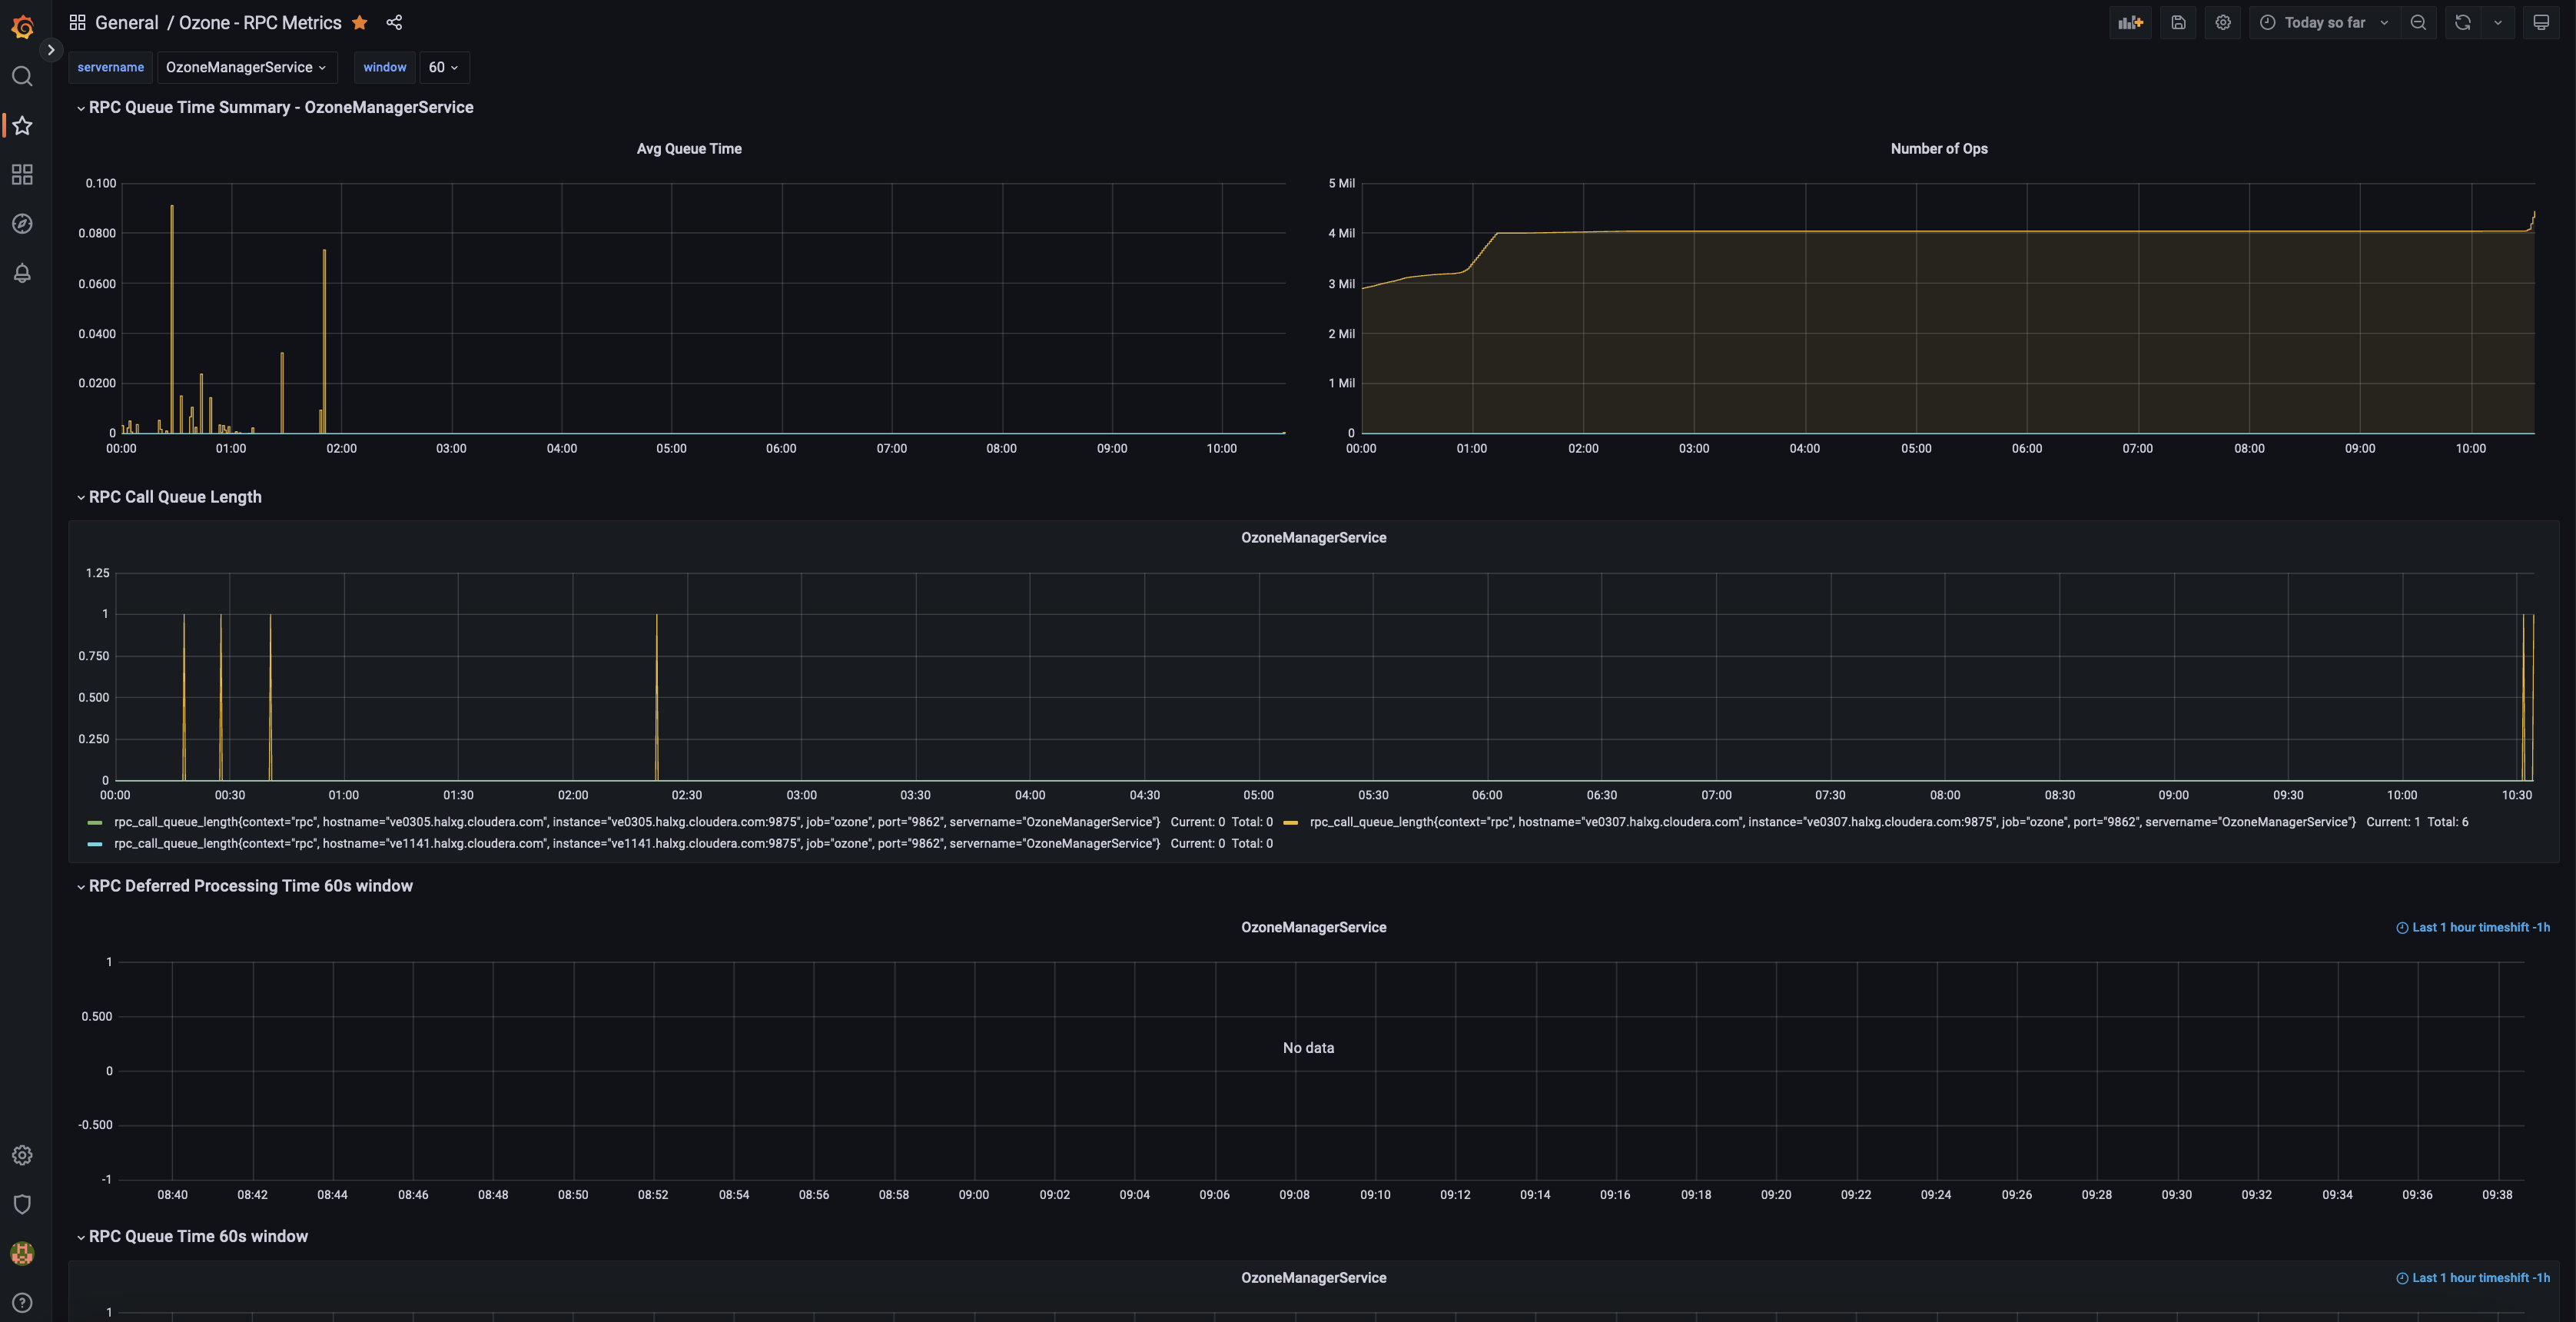
More dashboards are constantly being added. Check out the dashboard repo for more.
Check out the official Grafana doc Monitor Apache Ozone with Prometheus and Grafana Cloud for more details.
评论
登录后参与评论