 KnowForge
Profiling Cookbook
 qianmoQ· 更新于 2026-09-23· 阅读 10 分钟· 0 次阅读
Profiling Cookbook
The section contains examples how to perform CPU profiling for Apache DataFusion on different operating systems.
Building a flame graph
Video: how to CPU profile DataFusion with a Flamegraph
A flamegraph is a visual representation of which functions are being run You can create flamegraphs in many ways; The instructions below are for cargo-flamegraph which results in images such as this:

MacOS
Step 1: Install the flamegraph Tool
To install flamegraph, run:
cargo install flamegraphStep 2: Prepare Your Environment
Ensure that you’re in the directory containing the necessary data files for your DataFusion query. The flamegraph tool will profile the execution of your query against this data.
Step 3: Running the Flamegraph Tool
To generate a flamegraph, you’ll need to use the -- separator to pass arguments to the binary you’re profiling. For datafusion-cli, you need to make sure to run the command with sudo permissions (especially on macOS, where DTrace requires elevated privileges).
Here is a general example:
sudo flamegraph -- datafusion-cli -f <path_to_sql_file/sql_file.sql>Example: Generating a Flamegraph for a Specific Query
Here is an example using 28.sql:
sudo flamegraph -- datafusion-cli -f 28.sqlYou can also invoke the flamegraph tool with cargo to profile a specific test or benchmark.
Example: Flamegraph for a specific test:
CARGO_PROFILE_RELEASE_DEBUG=true cargo flamegraph --root --unit-test datafusion -- dataframe::tests::test_array_aggExample: Flamegraph for a benchmark
CARGO_PROFILE_RELEASE_DEBUG=true cargo flamegraph --root --bench sql_planner -- --benchCPU profiling with XCode Instruments
Video: how to CPU profile DataFusion with XCode Instruments
Profiling using Samply cross platform profiler
There is an opportunity to build flamegraphs, call trees and stack charts on any platform using Samply
Install Samply profiler
cargo install --locked samplyMore Samply installation options
Run the profiler
samply record --profile profiling ./my-application my-argumentsProfile the benchmark
Set up benchmarks if not yet done
Example: Profile Q22 query from TPC-H benchmark. Note: --profile profiling to profile release optimized artifact with debug symbols
cargo build --profile profiling --bin tpch
samply record ./target/profiling/tpch benchmark datafusion --iterations 5 --path datafusion/benchmarks/data/tpch_sf10 --prefer_hash_join true --format parquet -o datafusion/benchmarks/results/dev2/tpch_sf10.json --query 22
After sampling has completed the Samply starts a local server and navigates to the profiler
Local server listening at http://127.0.0.1:3000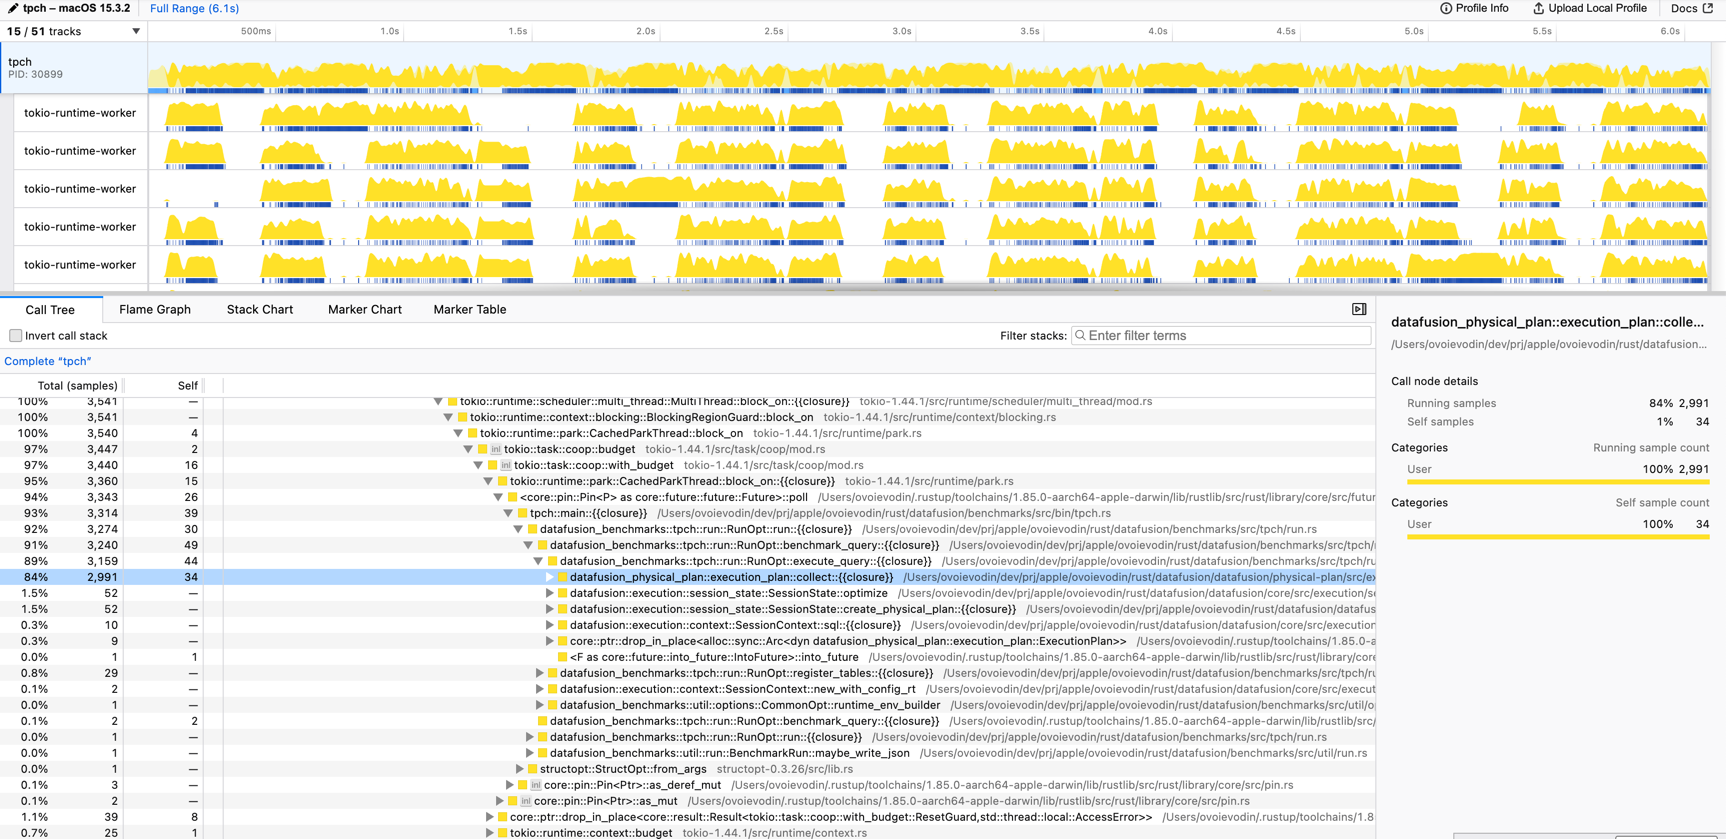
Note: The Firefox profiler cannot be opened in Safari, please use Chrome or Firefox instead
评论
登录后参与评论